Enhancing Cybersecurity Governance: Key Metrics and Reporting for GRC
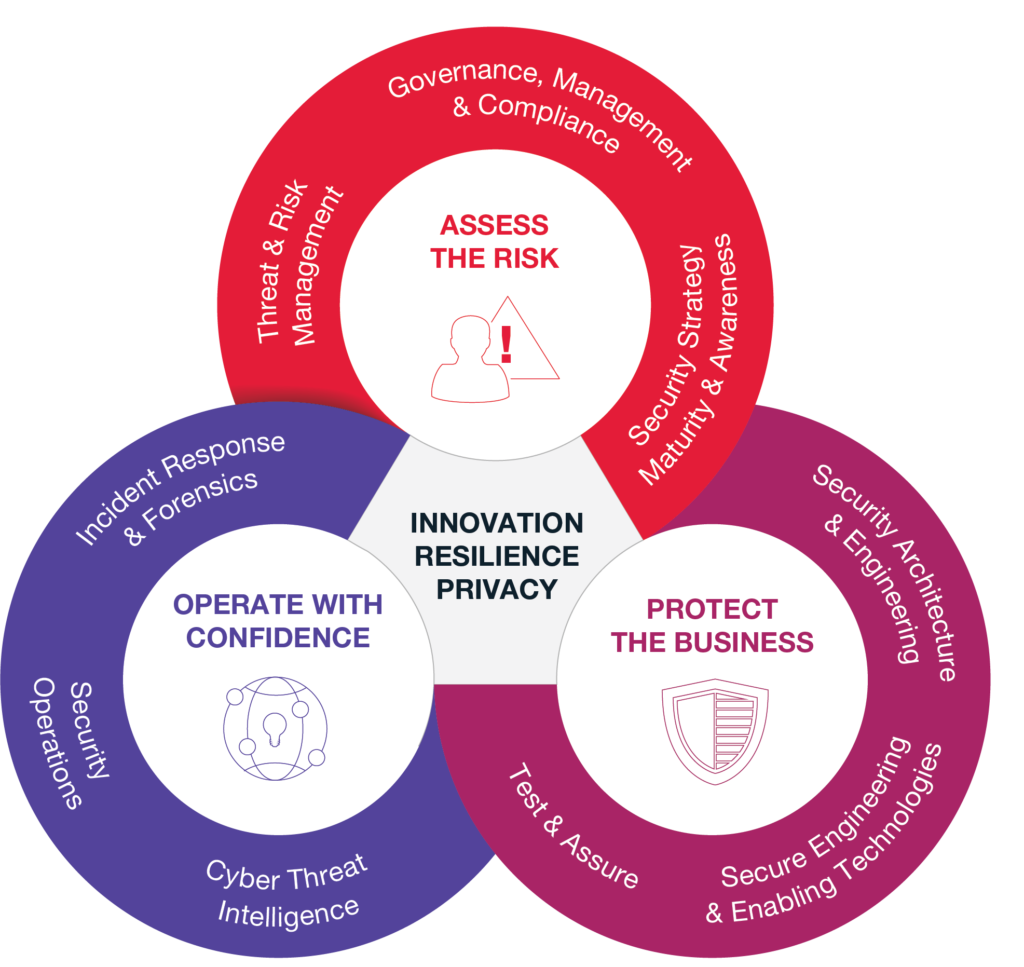
In today’s digital landscape, where cyber threats are evolving rapidly, organizations must adopt a proactive and holistic approach to cybersecurity. This is where Governance, Risk Management, and Compliance (GRC) frameworks play a pivotal role. GRC efforts are designed to align an organization’s cybersecurity practices with its business objectives while ensuring regulatory compliance and risk mitigation. But how can an organization measure the effectiveness of its GRC efforts? This is where cybersecurity metrics and reporting come into play.

Understanding GRC in Cybersecurity
Governance, Risk Management, and Compliance (GRC) is a strategic framework that helps organizations manage risks and compliance challenges while aligning their operations with business goals. In the context of cybersecurity, GRC involves creating policies, procedures and controls to safeguard digital assets, sensitive data, and IT systems. Effective GRC ensures that security measures align with industry standards and regulatory requirements, ultimately reducing the organization’s exposure to cyber threats.
Key Performance Indicators (KPIs) and Metrics for GRC in Cybersecurity
Risk Exposure Rate: This metric quantifies the organization’s vulnerability to cyber risks by assessing the number of high-priority vulnerabilities present in critical systems. A decreasing trend in risk exposure indicates improved cybersecurity efforts.
- Calculation Method: Number of high-priority vulnerabilities in critical systems / Total number of critical systems.
- Interpretation: A decreasing trend in risk exposure rate indicates improved cybersecurity efforts, as fewer vulnerabilities in critical systems suggest enhanced risk management.
Patch Management Effectiveness: This KPI measures how efficiently security patches are deployed across the IT infrastructure. A high percentage of up-to-date patches signifies strong risk mitigation.
- Calculation Method: (Number of systems with up-to-date patches / Total number of systems) * 100.
- Interpretation: A higher percentage signifies that a larger portion of the organization’s systems is protected against known vulnerabilities due to effective patch management.
Incident Response Time: Tracking the time it takes to detect, respond to, and mitigate security incidents helps gauge the organization’s preparedness to handle cyber threats promptly.
- Calculation Method: Time taken to detect and mitigate an incident.
- Interpretation: A shorter incident response time indicates a more efficient and prepared incident response team, minimizing potential damages from cyber incidents.
Compliance Adherence: This metric evaluates how well the organization adheres to industry regulations and compliance standards. It assesses the percentage of controls that are compliant and identifies areas needing improvement.
- Calculation Method: (Number of compliant controls / Total number of controls) * 100.
- Interpretation: A higher compliance adherence percentage reflects the organization’s commitment to meeting regulatory requirements and industry standards.
Phishing Resilience: Measuring the click-through rate on simulated phishing emails provides insight into the organization’s susceptibility to social engineering attacks. Lower click-through rates indicate effective employee training and awareness programs.
- Calculation Method: (Number of employees who did not click on simulated phishing emails / Total number of employees) * 100.
- Interpretation: A higher percentage suggests that employees are better equipped to identify and avoid phishing attacks, demonstrating the success of security awareness programs.
Security Awareness Training Completion: Monitoring the percentage of employees who have completed mandatory cybersecurity training helps assess the effectiveness of awareness initiatives.
- Calculation Method: (Number of employees who completed training / Total number of employees) * 100.
- Interpretation: A higher completion rate indicates better participation in cybersecurity training initiatives, contributing to improved security awareness.
Mean Time to Detect (MTTD) and Mean Time to Respond (MTTR): These metrics measure the average time taken to detect a security breach and the subsequent time taken to respond and mitigate it. Lower MTTD and MTTR values indicate efficient incident management.
- Calculation Method (MTTD): Total time taken to detect incidents / Number of incidents.
- Calculation Method (MTTR): Total time taken to respond to and mitigate incidents / Number of incidents.
- Interpretation: Lower MTTD and MTTR values indicate faster detection and response, reflecting a more effective incident management process.
Security Control Effectiveness: Regularly evaluating the efficiency of security controls, such as firewalls and intrusion detection systems, provides insights into the organization’s ability to prevent and detect cyber threats.
- Calculation Method: (Number of detected threats blocked by security controls / Total number of detected threats) * 100.
- Interpretation: A higher percentage suggests that security controls are successfully preventing a larger proportion of detected threats, indicating their effectiveness.
User Privilege Management: Tracking the number of excessive user privileges and the speed at which they are revoked after an employee’s role changes helps reduce the attack surface.
- Calculation Method: (Number of revoked excessive user privileges / Total number of excessive user privileges) * 100.
- Interpretation: A higher percentage reflects proactive user privilege management, reducing the attack surface by minimizing unnecessary access.
Cybersecurity Investment ROI: This metric assesses the return on investment for cybersecurity expenditures by measuring the reduction in potential financial losses due to cyber incidents.
- Calculation Method: (Potential financial loss without cybersecurity measures – Potential financial loss with cybersecurity measures) / Cybersecurity investment cost.
- Interpretation: A positive ROI indicates that the investment in cybersecurity measures has yielded financial benefits by reducing potential losses from cyber incidents.
Reporting for GRC in Cybersecurity
Effective reporting is essential for communicating the progress and impact of GRC efforts to stakeholders, executives, and regulatory bodies. When preparing cybersecurity reports for GRC, consider the following points:
Clarity and Context: Reports should provide clear and concise information, including context about the significance of the metrics and their alignment with organizational goals.
Trends and Comparisons: Highlight trends and changes over time, allowing stakeholders to identify improvements or areas requiring attention. Comparing metrics against industry benchmarks adds valuable context.
Actionable Insights: Alongside presenting data, offer insights and recommendations for addressing weaknesses and building on strengths to enhance GRC efforts.
Visual Representation: Utilize graphs, charts, and infographics to present data visually. Visualizations make it easier for non-technical stakeholders to grasp the significance of the metrics.
Regulatory Alignment: Ensure that the reports address specific compliance requirements and demonstrate how the organization is meeting those standards.
Conclusion
In a digital landscape fraught with cyber risks, GRC efforts are indispensable for ensuring cybersecurity resilience. Metrics and reporting provide the means to measure the effectiveness of these efforts, offering a quantifiable way to track progress, identify vulnerabilities, and make informed decisions. By leveraging key performance indicators and meaningful reporting practices, organizations can enhance their cybersecurity GRC strategies and protect their digital assets in an ever-evolving threat landscape.


